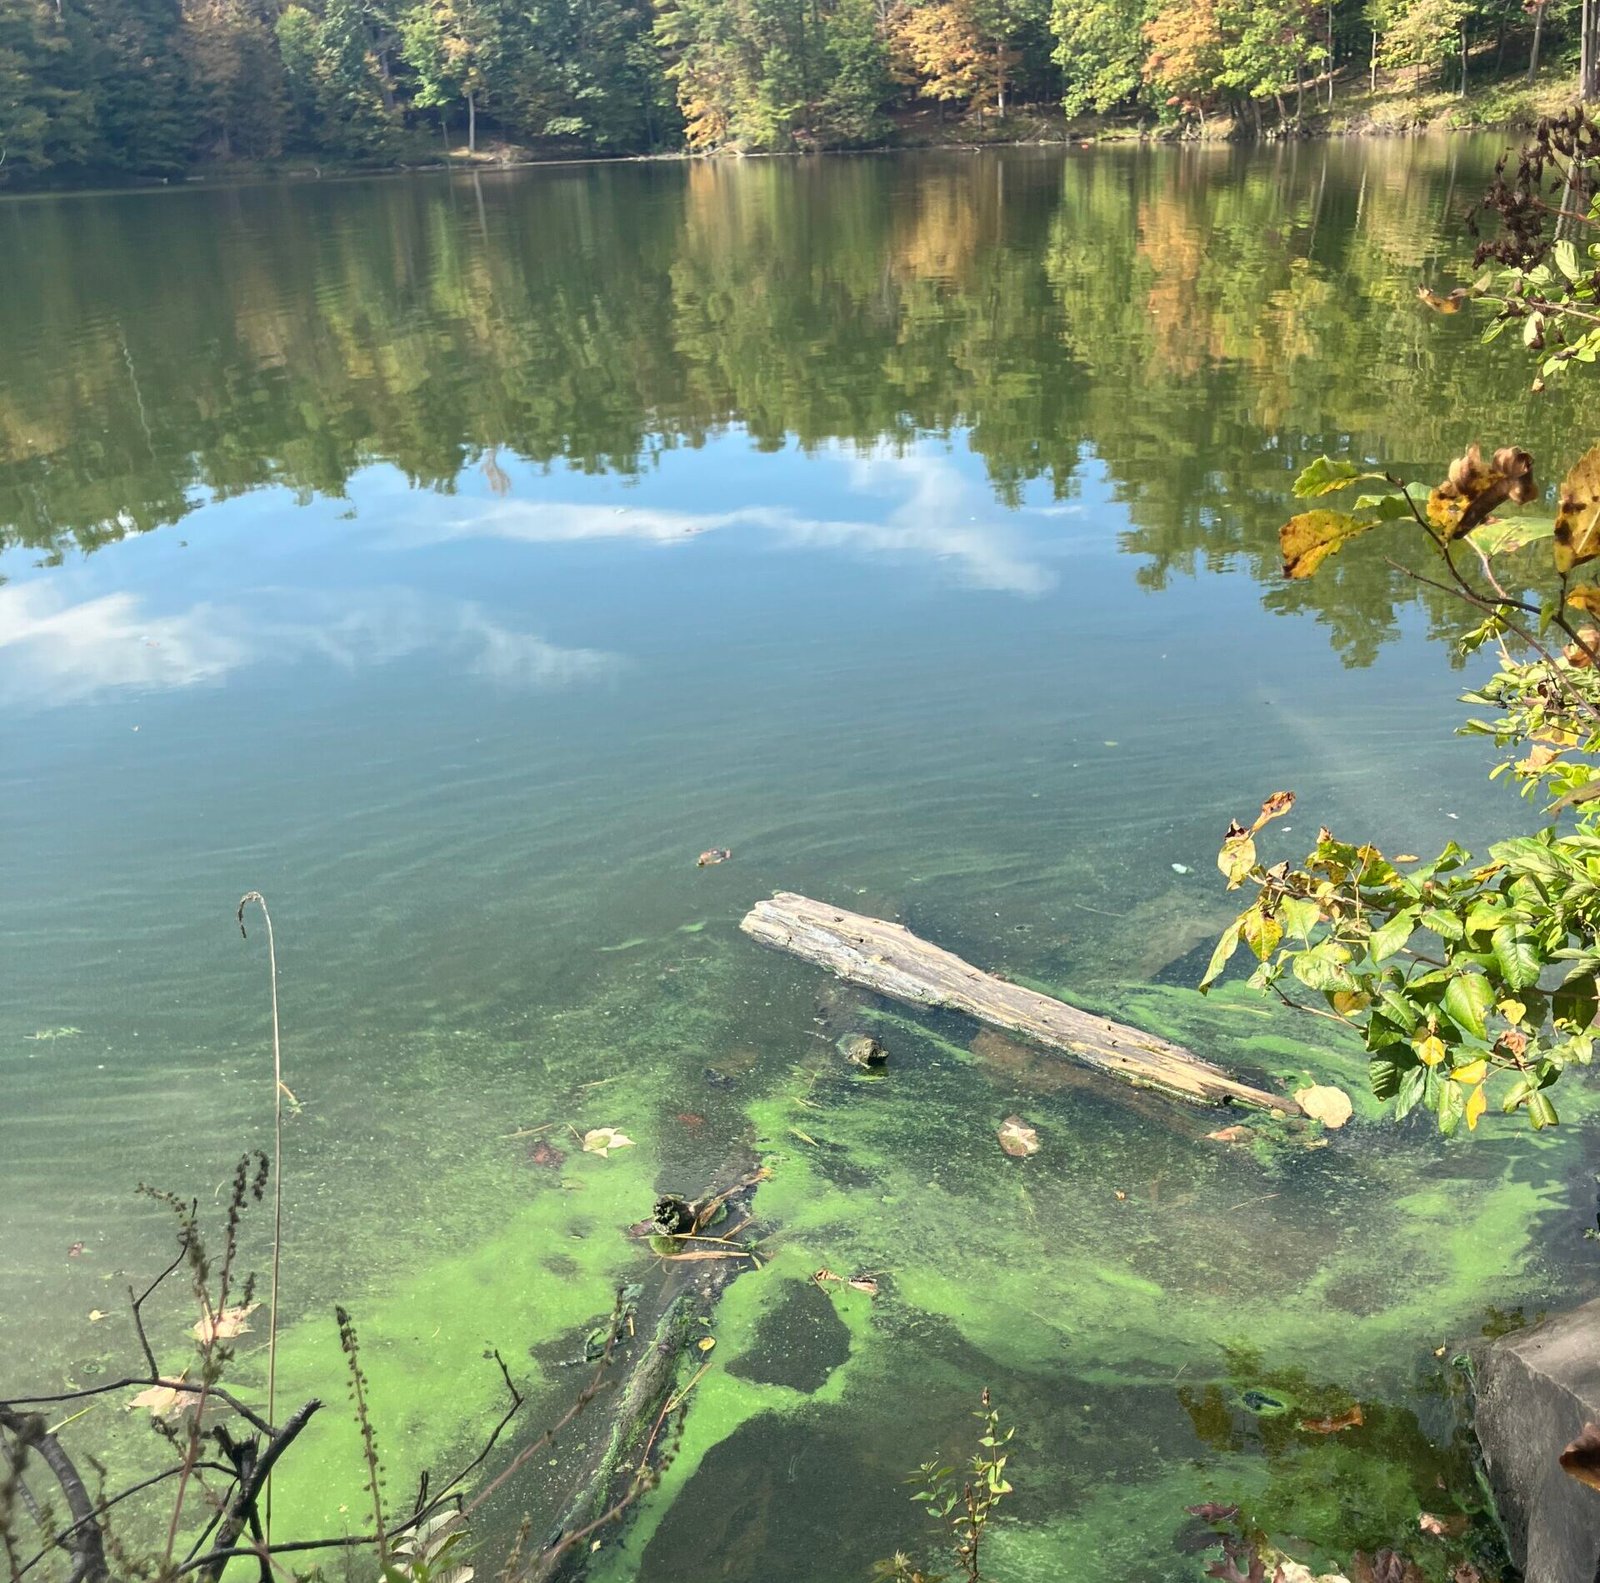
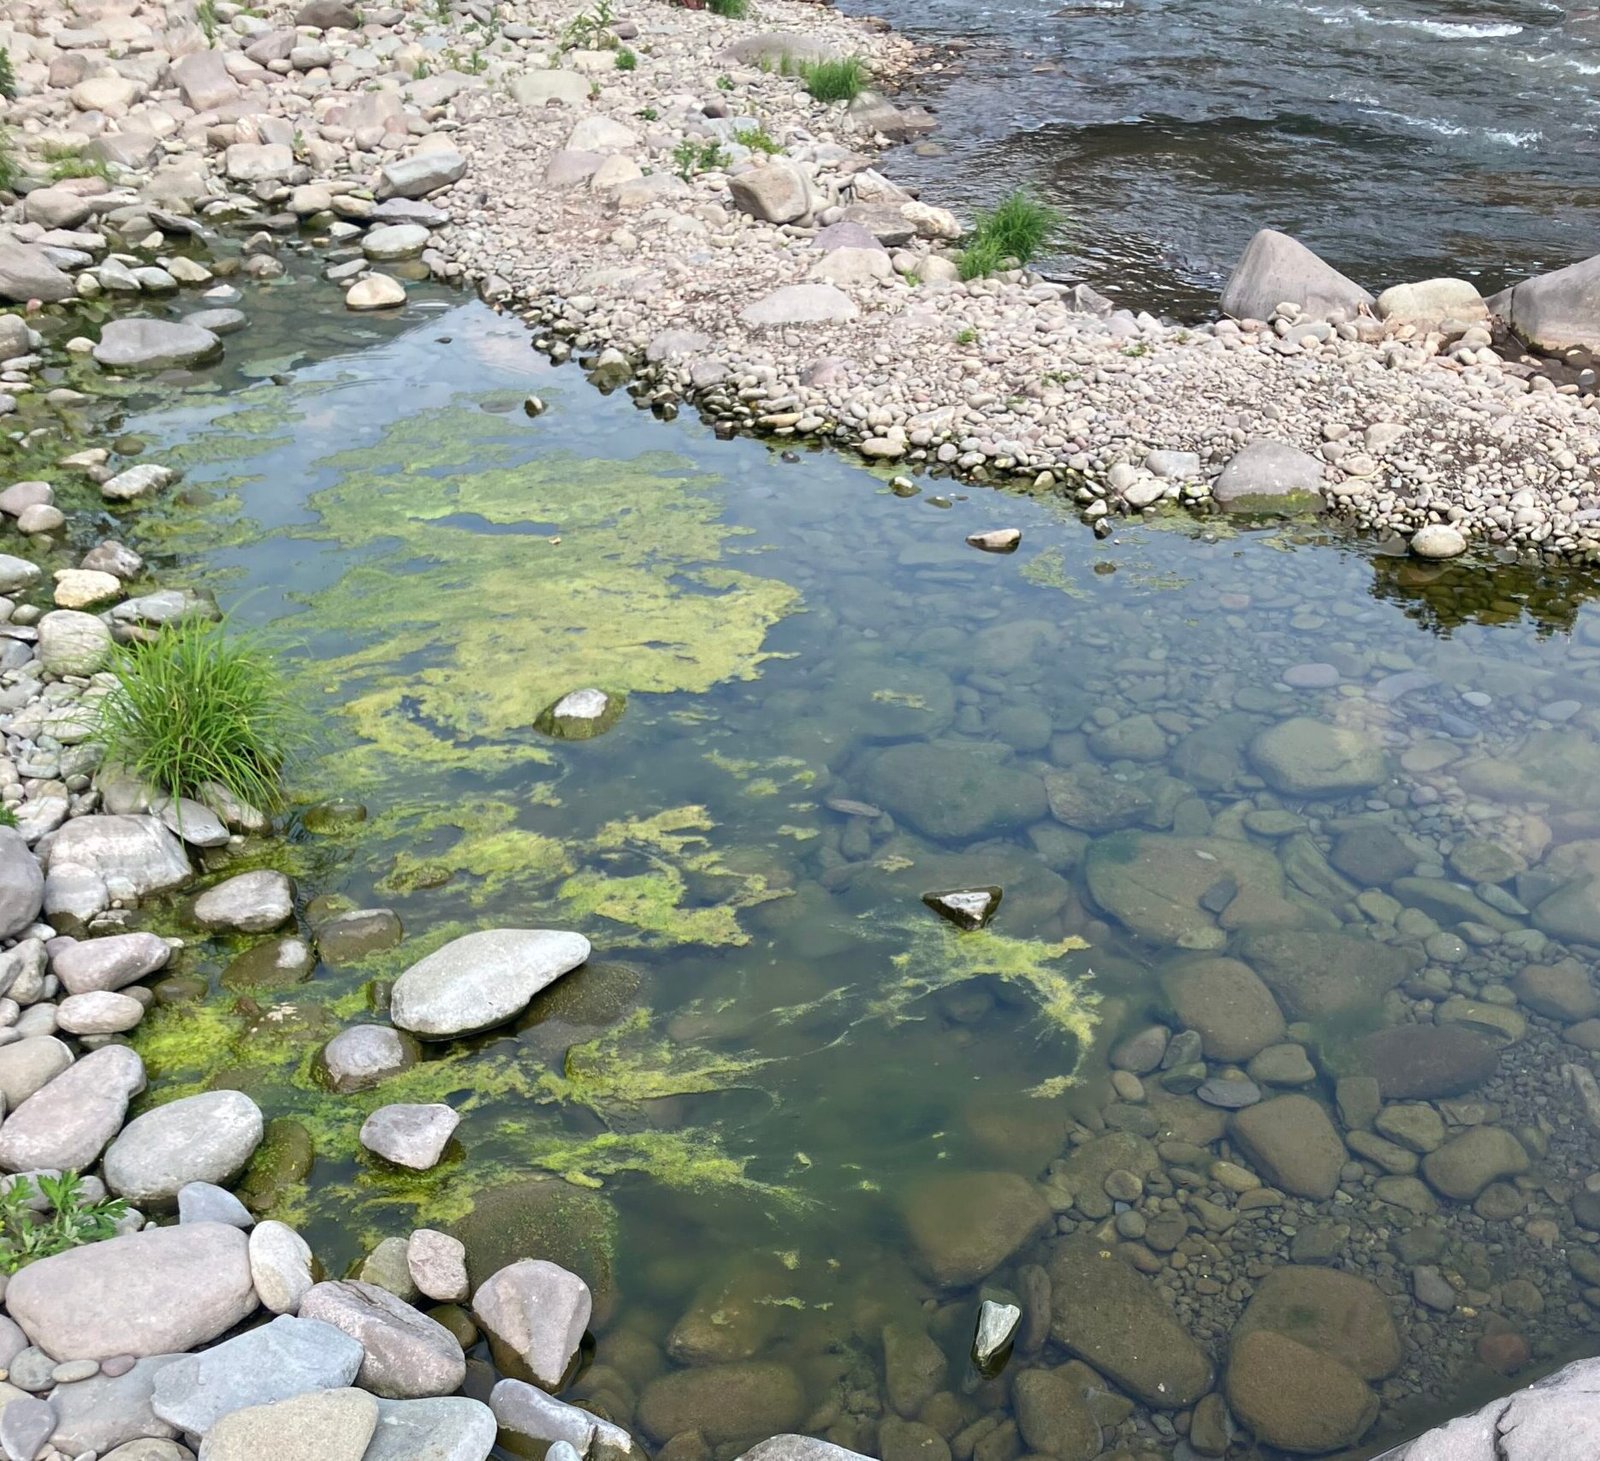
Our River Is Changing. We Need All Eyes on the Water.
Welcome to Eco Habit-BETA, a Bard College capstone project grounded in Community-Based Participatory Research (CBPR), where local knowledge and science work together to understand, identify, and monitor Harmful Algal Blooms (HABs) on the Wallkill River.
By following the steps in this exercise, your feedback will help us design the best possible community-friendly HABs website interface.
flag Your Mission (~10 Minutes)
👁️ Identify
Learn to tell harmless algae from suspicious surface scum.
📊 Analyze
Use real river data:, flow,temperature, conductivity — to co-interpret local risk (sources on last page).
🔬 Act
Put your skills to the test, then support shared community reporting and response.
What's Happening to the Wallkill?
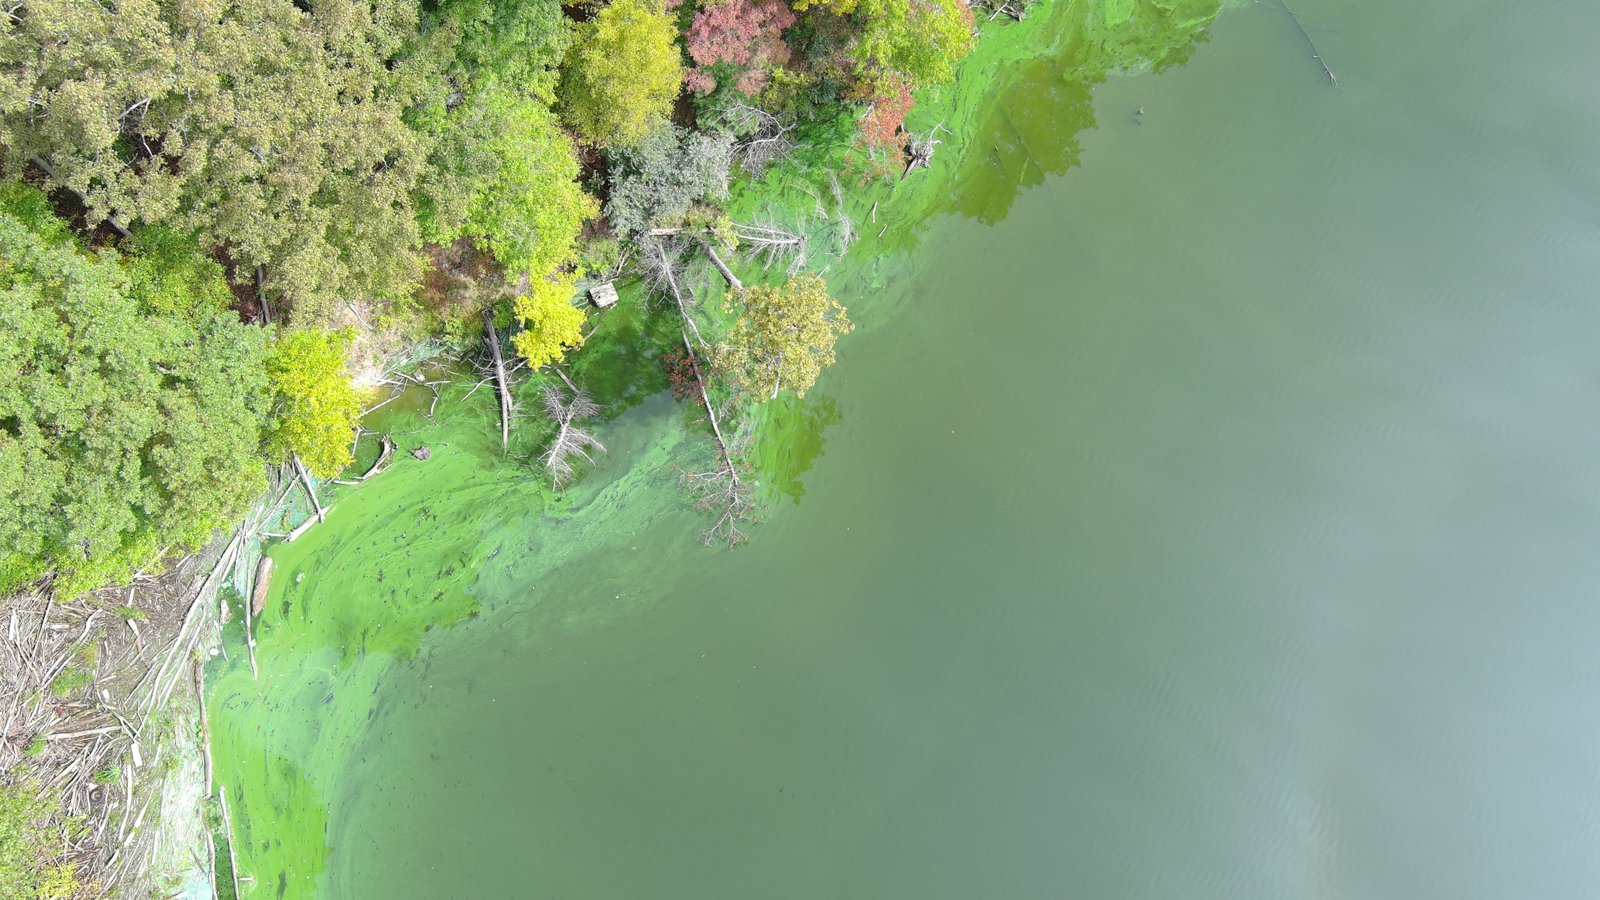
- Hot, dry summers bring more cyanobacteria blooms (HABs) to the Wallkill.
- Why it matters: bloom toxins like microcystin can sicken people and be fatal to dogs.
- Main drivers: warm water, slow flow, and nutrient runoff fuel blooms.
- Why you're needed: sensors and satellites miss details; community observations provide essential local context.
Use the square boxes in the top‑right layer panel to toggle pop‑ups on or off.
visibility_lock Participation & Privacy
Voluntary & Anonymous
Your participation is completely voluntary. We do not collect names, emails, or IP addresses. You may stop at any time.
Contact
If you have questions about this study, please contact researcher Robert Howe BH7406@bard.edu or Faculty Advisor Jennifer Phillips Phillips@bard.edu.
Ready to begin? To prove you're human, drag the slider all the way to the right. 👉
Slide the 💧 all the way to the 🌊 to unlock the consent checkbox.
Step 2: About You
Complete each field below, then click Continue. This gives context for your responses in the next steps.
Step 3: Spot the Bloom
Your task: Browse the images, choose the one that most looks like a harmful algal bloom, then review the map and continue to the data step.
🤔 Not sure? Open the Reference Guide for help identifying each type.
satellite_alt See It From Above
Toggle between Street and Satellite views using the layer controls (top-right corner). On satellite view, explore the landscape — can you spot the waterway, land use, or potential nutrient sources nearby?
Using the checkboxes in the layers panel, toggle the drone orthomosaic layers on and off. These were captured during the peak bloom season (September 2025). Zoom in to see how extensive the bloom was.
Your Selection from Step 3:
The sensor data below corresponds to conditions at this site.
Step 4: Read the Data
Read each gauge (flow, temperature, conductivity) click Next: Answer Contextual Questions to submit your interpretation.
This data reflects monitoring conditions at the time and location of the image you selected in Step 3.
Flow Rate 🌊
Temperature 🌡️
Conductivity⚡
🌊 Flow Rate < 150 CFS (Risky Conditions)
Low-flow conditions (stagnation) are the primary physical constraint for bloom formation; they increase residence time, allowing for the thermal stratification and buoyancy-driven surface accumulation necessary for cyanobacteria to dominate (Ignatius et al., 2022).
🌡️ Temperature > 25°C
Once flow is restricted, water temperature acts as the metabolic gatekeeper; Microcystis reach optimal growth efficiency only when temperatures exceed 25°C, outcompeting benign algae (Chorus & Welker, 2021).
⚡ Conductivity > 600 µS/cm
In the Lower Wallkill, elevated specific conductivity serves as a watershed-specific proxy for concentrated, nutrient-rich groundwater baseflow emerging from the Black Dirt Region (Allan & Castillo, 2007). These elevated nutrient levels create risky conditions for HAB formation.
- Low Water Flow (The Foundation): This is the most important part. When the river moves slowly or stands still, it gives the algae a stable place to sit and grow without being washed away.
- High Heat (The Switch): Warm water acts like a "power switch" for the algae. When it gets hot, it tells the algae it is time to start growing fast.
- High Conductivity (The Fuel): Conductivity shows us how many minerals and nutrients are in the water. High levels mean there is enough "food" (like nitrogen and phosphorus) to build a large, thick bloom.
bar_chart
Deep Dive: Charts & Data Guide
Click to view trends and
risk cutoffs
expand_more
These charts show river conditions leading up to the date associated with the image you selected. Look for trends that could explain the conditions you saw.
info Metric Thresholds
| Metric | Safe / Low Risk | High HAB Risk |
|---|---|---|
| Temperature | < 20°C | > 25°C |
| Flow Rate | > 300 CFS | < 150 CFS (Stagnant) |
| Conductivity | < 500 µS/cm | > 600 µS/cm |
Discharge Trend (USGS) — CFS
Temperature Trend — °C
psychology_alt Data Verification (Second Chance)
Now compare your photo choice with the data. Does the data support HAB risk at this site?
Step 5: Make Your Call
Answer all six prompts using both visual evidence and sensor data, then click Submit Analysis.
Step 6: Test Your Skills
Use the new sensor readings to pick the best matching image, add a short explanation, and continue.
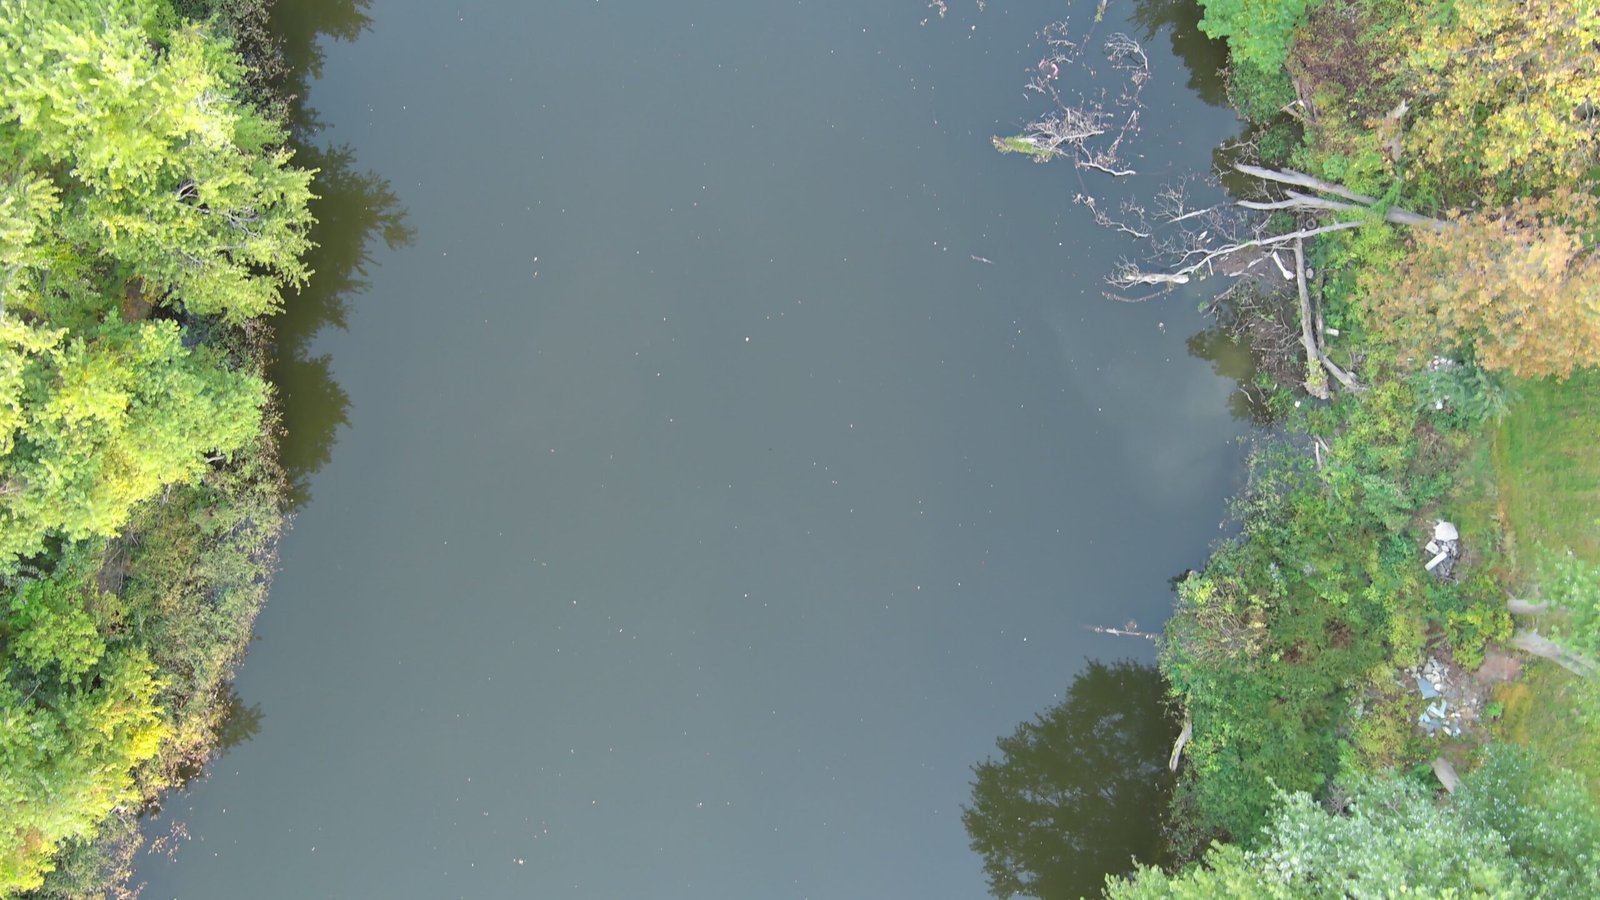
New scenario: Here's a fresh set of sensor readings. Which image best matches these conditions?
info New Scenario Data
--°C
-- µS/cm
-- CFS
Review these conditions carefully. Based on what you've learned, which image best matches?
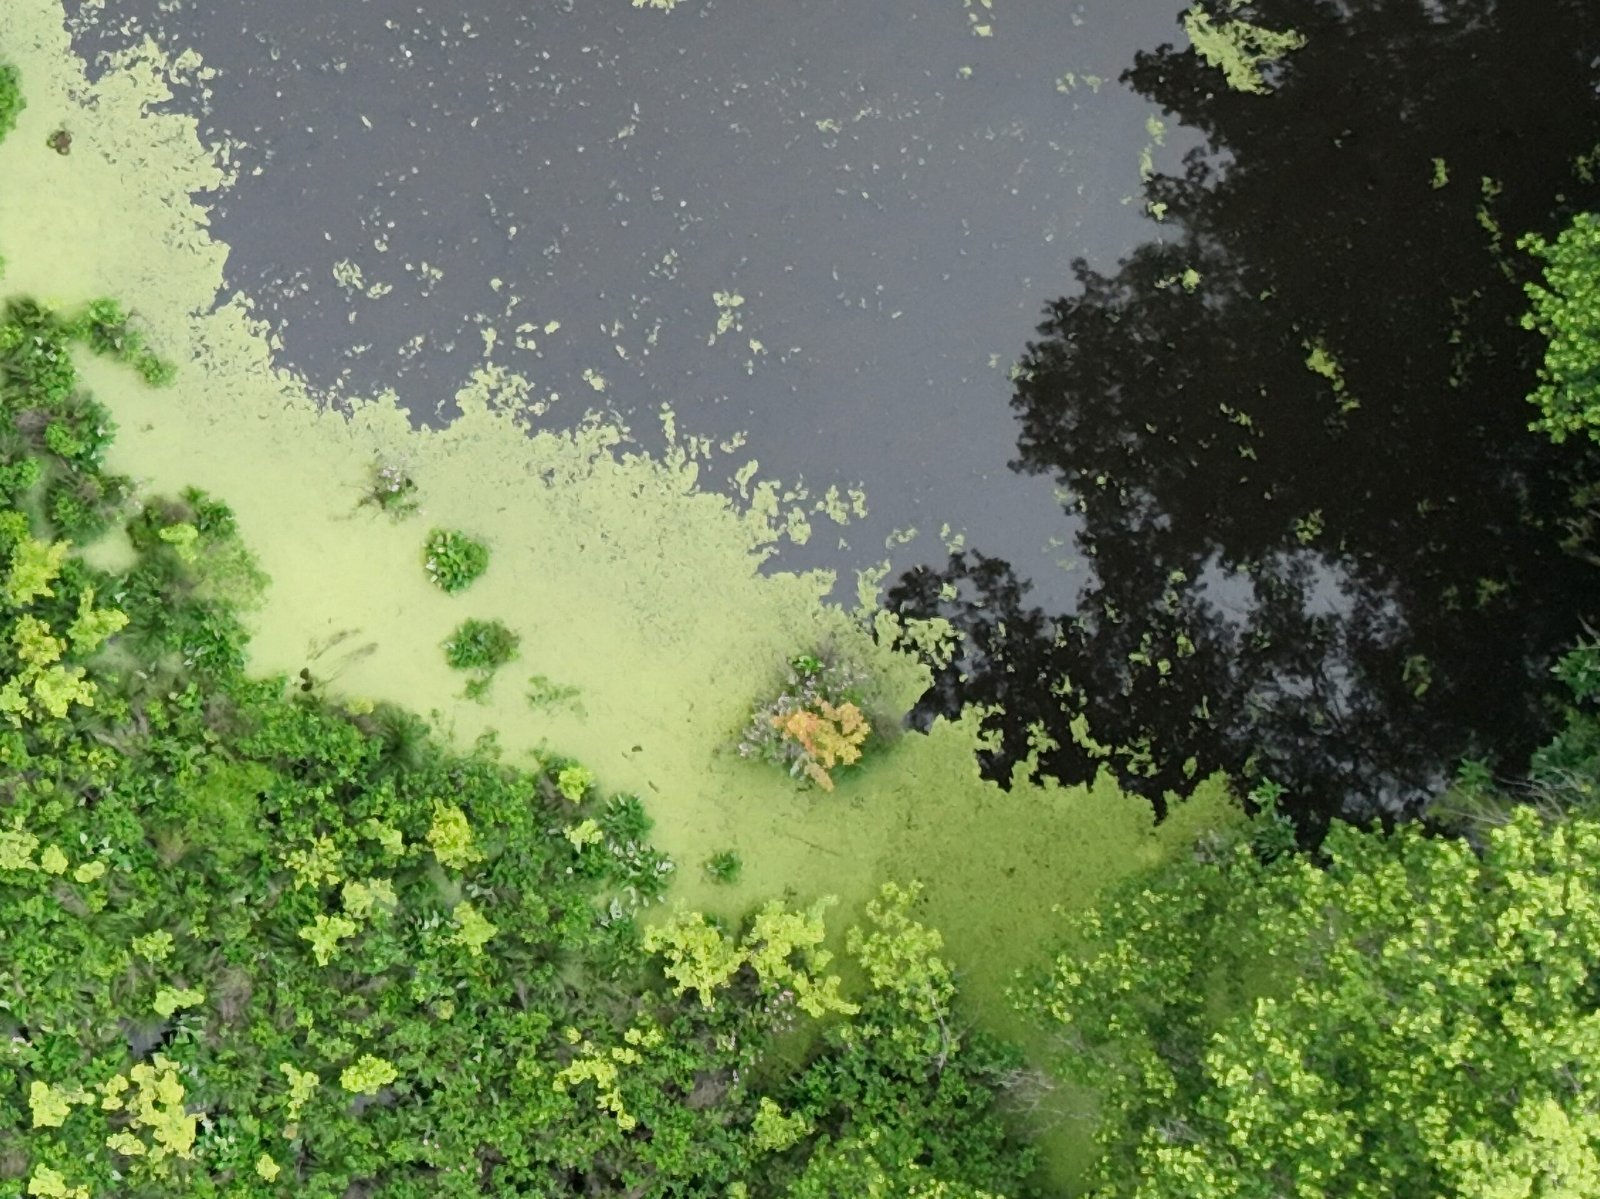
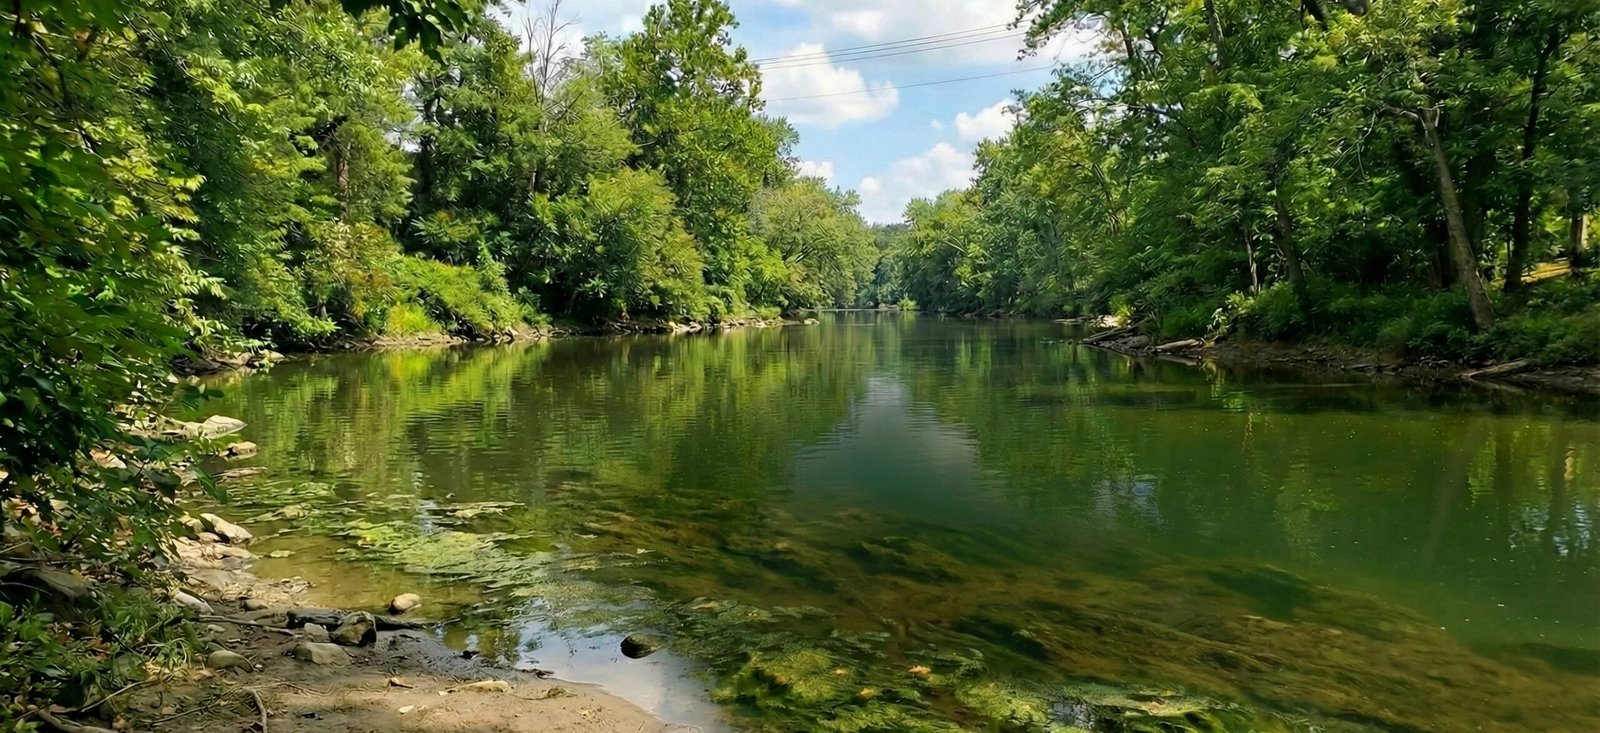
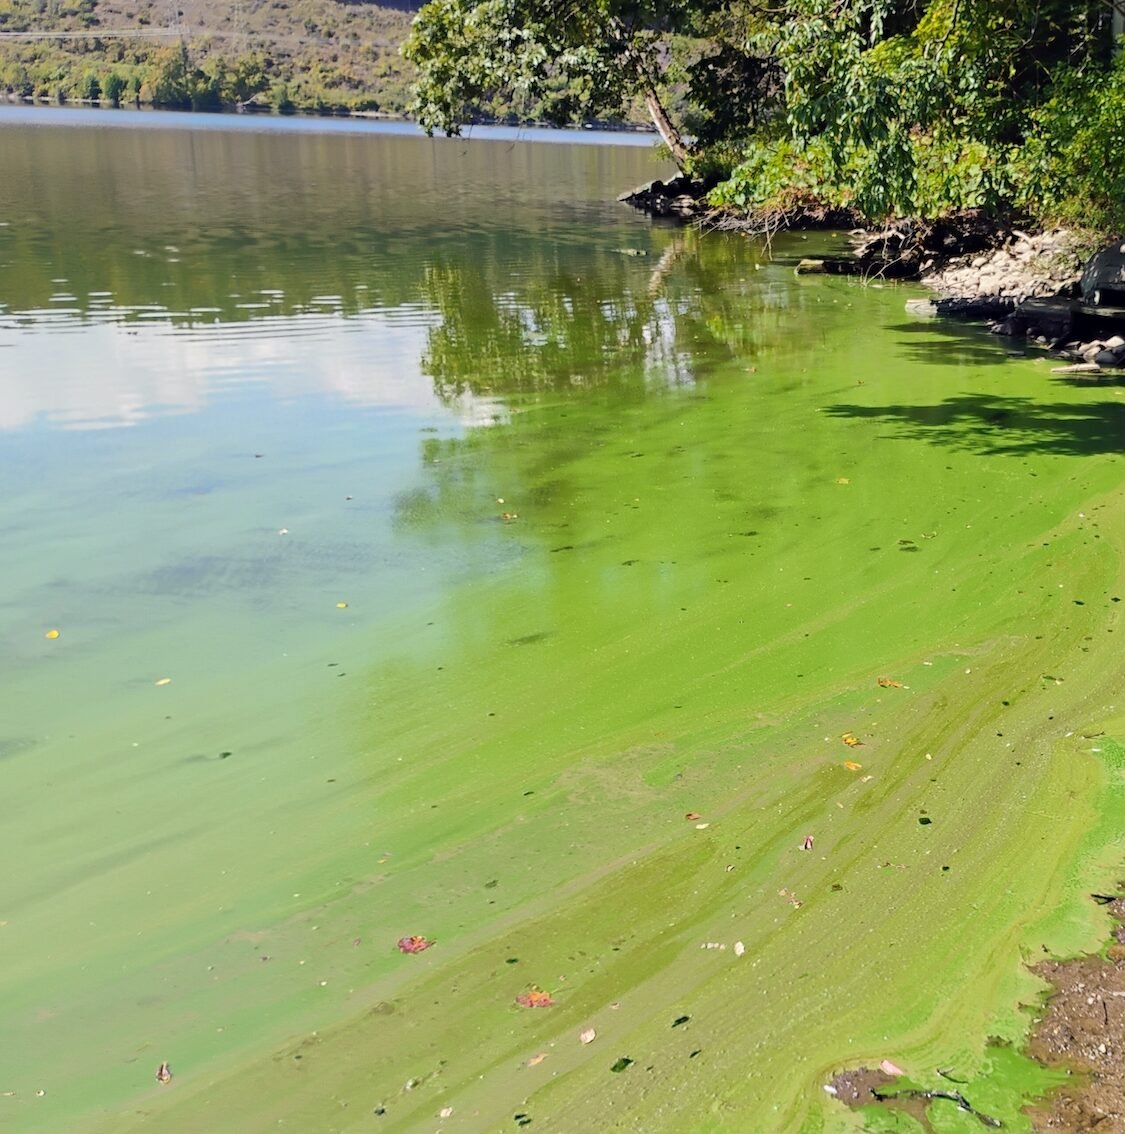
Rank these actions in priority order (1st, 2nd, 3rd).
Step 7: Community Knowledge Recap (CBPR)
Review the recap, reflect on what was most challenging, then choose how you want to contribute in the next step.
visibility Step 3 — Spot the Bloom
- Harmful algal blooms (HABs) often appear as bright green, blue-green, or brownish films on the water surface.
- Not every green patch is a HAB — duckweed, pollen, and reflections can look similar.
- Visual identification is a first line of defense for community observers and citizen scientists.
monitoring Step 4 — Read the Data
- Flow Rate (Primary Constraint): Low-flow conditions (stagnation) are the primary physical constraint for bloom formation; they increase residence time, allowing for the thermal stratification and buoyancy-driven surface accumulation necessary for cyanobacteria to dominate (Ignatius et al., 2022).
- Temperature: Once flow is restricted, water temperature acts as the metabolic gatekeeper; Microcystis reach optimal growth efficiency only when temperatures exceed 25°C, outcompeting benign algae (Chorus & Welker, 2021).
- Conductivity: In the Lower Wallkill, elevated specific conductivity serves as a watershed-specific proxy for concentrated, nutrient-rich groundwater baseflow emerging from the Black Dirt Region (Allan & Castillo, 2007).
assessment Step 5 — Make Your Call
- Combining visual cues with sensor data gives you a much stronger assessment.
- High temp + low flow + high conductivity = elevated HAB risk.
- Your judgment matters — even experts weigh multiple indicators before deciding.
quiz Step 6 — Test Your Skills
- Applying what you learned to a new scenario reinforces pattern recognition.
- Matching sensor readings to visual conditions builds real-world monitoring confidence.
- Practice makes permanent — the more scenarios you evaluate, the sharper your instincts.
At this point, you can complete the exercise or continue to the advanced remote sensing module. Click a card below to choose your path:
Choose Your Path
How would you like to contribute to HAB awareness and response?
Recreator
I use the river for recreation and want to make safer, informed decisions for myself and others.
Steward / Scientist
I want to learn how to use remote sensing data and community observations to monitor HABs.
Step 8: Remote Sensing / Monitoring
Compare satellite views with field observations, upload a screenshot of peak bloom intensity, and add notes to help ground-truth what satellites detect.
help How to Use This Tool
- Check date: Note when the satellite image was captured.
- Find location: Locate Sturgeon Pool on the left side of the frame.
- Use the timeline: Use the date slider at the bottom to step through recent satellite passes.
- Read the legend: Red and orange indicate higher risk.
- Check for clouds: ⚠️ White or gray blobs are clouds, not blooms.
- Zoom in: Click "Open Fullscreen" for more detail.
compare_arrows What You're Comparing
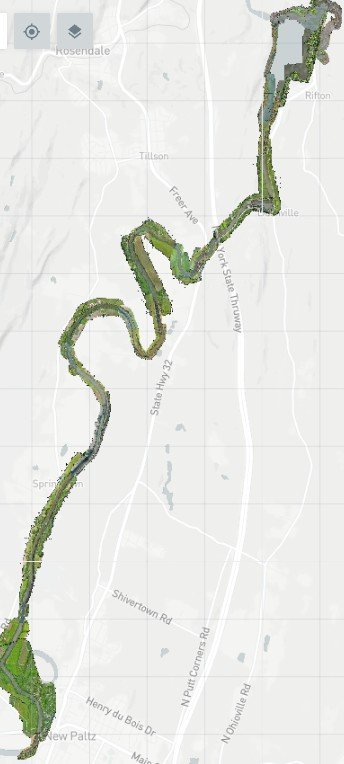
The Mapbox map below shows drone orthomosaic imagery of Sturgeon Pool. Using the date checkboxes on the right side of the map, toggle the dates on and off to see layers captured during the peak of the bloom season last summer. Zoom in to see just how extensive the bloom was in late September 2025.
This imagery was captured on September 27, 2025, during the most intense bloom event of the season — the green you see in the water is real cyanobacteria.
The Copernicus satellite view below shows the same area from space using imagery a few weeks before the peak of the bloom. Your task: Compare the two — does the satellite pick up the same bloom patterns you can see in the drone imagery? Where do they agree, and where do they miss? This is exactly how researchers ground-truth remote sensing data.
Map Legend: Phycocyanin Index (PCI) — μg/L
If you can, take a screenshot showing where the bloom appears most intense — this helps us understand how satellite imagery compares to what you saw on the ground.
Step 9: Final Reflection
Almost done! Take a moment to reflect on the exercise before answering these final questions. Complete these fields, then click Complete Exercise to finish and export your results.
Thank You!
Your time is deeply appreciated. By participating in this exercise and learning about Harmful Algal Blooms (HABs), you've contributed to a shared, community-centered effort to protect the Wallkill River.
Thank you for being the eyes and ears of the Wallkill River. Together, we're building a more resilient watershed.
🚨 Remember: If the water looks like spilled green paint — when in doubt, stay out! Keep pets on a leash, take a photo from a safe distance, and report it.
What's Next?
- Your anonymous responses help co-create stronger HAB education and monitoring for the Wallkill community.
- To report suspected HABs on the Wallkill River:
- NYS DEC: HABs Reporting Portal
- Follow the Wallkill River Watershed Alliance (WRWA) website for water quality updates.
Best regards,
Robert Howe
Bard College Graduate Center for Environmental Policy
Want to explore more open‑source aerial imagery of the Wallkill River during the 2025 HAB season?
📚 Data Sources & Works Cited
All environmental datasets embedded in this exercise are listed below for transparency and reproducibility.
| Data Source | Type | Geographic Scope | Temporal Coverage | Embedded Where |
|---|---|---|---|---|
| USGS Stream Gauge 01371500 WALLKILL RIVER AT GARDINER NY |
Flow rate (CFS) | Wallkill River at New Paltz | Summer–Fall 2025 | Step 4 Discharge Trend chart + gauge |
| Temperature Sensor Wallkill River 32 Bridge (WKR32BRDG) |
Water temperature (°C) | Wallkill River at New Paltz | Summer–Fall 2025 | Step 4 Temperature Trend chart + gauge |
| Conductivity Sensor Wallkill River 32 Bridge (WKR32BRDG) |
Conductivity (µS/cm) | Wallkill River at New Paltz | Summer–Fall 2025 | Step 4 Conductivity gauge |
| Drone Orthomosaic | RGB aerial imagery (3.1 cm/pixel) | Sturgeon Pool, Wallkill River | September 2025 (multiple dates incl. Sept. 27 peak) | Steps 3, 7 (Mapbox map) |
| Copernicus Satellite | Phycocyanin Index (PCI, µg/L) | Sturgeon Pool / Lower Wallkill area | Summer–Fall 2025 | Step 8 |
| Field Photographs | Ground-level HAB imagery | Multiple Wallkill River sites | Summer 2025 | Step 3 image gallery |
| OpenAerialMap | Drone imagery / orthophotos | Wallkill River watershed (approx.) | various dates | Step 3 / drone reference |
📄 Optional: Your Observation Report
If you'd like, you can download a PDF copy of your satellite observation and screenshot for your records.
You may now close this window.